Spectroscopy is the study of the interaction between matter and radiated energy. Historically, spectroscopy originated through the study of visible light dispersed according to its wavelength, e.g., by a prism. Later the concept was expanded greatly to comprise any interaction with radiative energy as a function of its wavelength or frequency.
Spectroscopic data is often represented by a spectrum, a plot of the response of interest (amplitude) as a function of wavelength or frequency. This is often referred to as spectral power distribution (SPD).

At FireDiveGear.com, we use spectroscopy to analyze and calibrate our torches, excitation filters and barrier filters for peak performance.
The figure here to the right is a representation of what happens when you shine a white light through a prism. The light is broken up into its component colors because each color has its own energy level and hence has its own path it takes through the prism.
We use an ASEQ Spectrometer in all of our analysis work. Basically it is a box with an input port for light to enter. The light is then sent through a prism (“diffraction grating”).
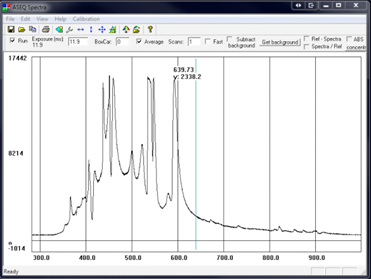
The pattern similar to that shown in the figure adjacent hereto is then deposited onto a photo sensor where each color generates a corresponding electrical signal. These signals are then sent to a computer where the data is processed and displayed as an image like that in the left figure below.
The higher the signal for each particular color, the higher the amplitude displayed on the screen for that particular wavelength. This is what is meant by spectral power distribution. Using this technique, we can custom design filters and calibrate filter and LED combinations to exactly the performance parameters we desire.

For a very detailed discussion as to why it is ill advised to use an excitation filter over a white light torch, see the following document:
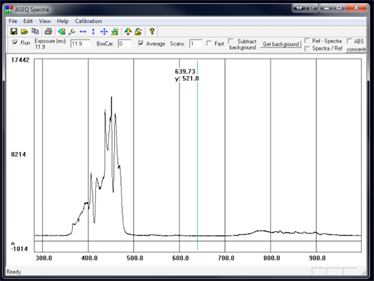
However, below are a few examples of putting an excitation filter over a white light torch for your reference. Consider yourself forewarned before you request a custom filter configuration..
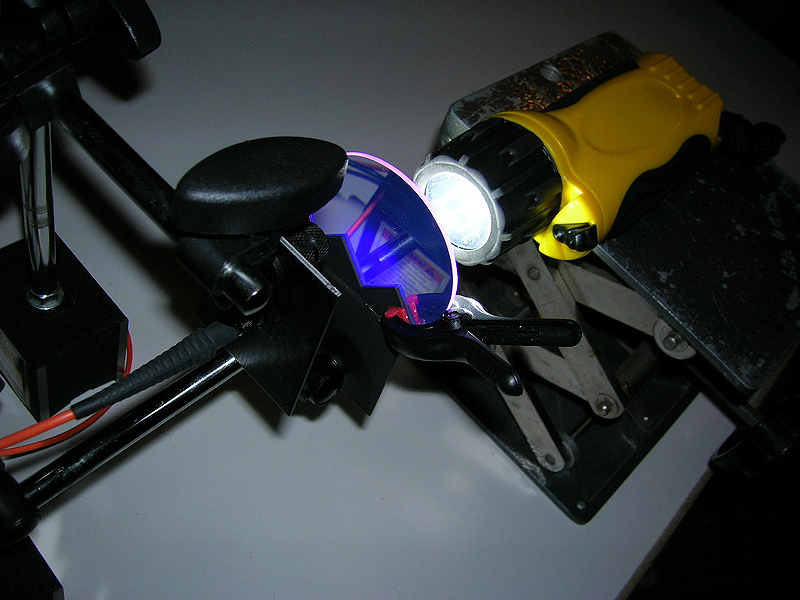
Photo © 2012 L. Miner
The photo at the top right shows a typical setup for spectrographic measurements.
Spectograph Examples
The purpose of this section is to give you a rough idea of the spectral content of what you may have at your disposal if you own one of these torches.
As mentioned in the science section, the best combination is a torch with high performance blue LEDs and a dichroic filter. However, some have found the results of just using a dichroic filter over a white light source “gets the job done” to their satisfaction.
This is why we offer custom filters and mounts for many white light torches. The images of this page are provided to help you decide whether what you have will perform for you.